Why are there so much earthquakes lately

Status
Not open for further replies.
Pericles, you of course neglected to cut and paste this footnote at the bottom of the article:

Update: we seem to have some answers! The above graph is an artefact of selective data. As some readers don't go through all the comments here is the link to the relevant comment and a new graph
(well actually you did cut and paste it, I saw it a second ago then obviously when you realised that it didn't serve your argument you removed it)

which leads to an article explaining how that graph is based on what the USGS defines as 'selected earthquakes of historical interest'

I mean holy crap from the beginning of time to 1555 AD there were only 5 'notable' (as you define them) earthquakes.

The article then links to some other graphs of magnitude 6 and higher quakes from 1980 to 2009 showing a far less dramatic increase albeit over a very limited period of time.
 
On a more serious note read http://across.co.nz/WorldsWorstDisasters.html

and see how many huge earthquakes there have been in history. They are by their nature random events, unpredictable and unstopable.
The great minds have been telling us that Japan is overdue a huge siesmic event as is California. I think that to try and put any sort of theory into recent events is going to be in the end fruitless.
Next year may well be totally calm (well all the quakes in uninhabited places) or it could be chaotic. Only time will tell.
 
pericles said:
The intensity of the earthquakes as well as the frequency has increased . This year alone we had over 4 major earthquakes with significant loss of life . The Haiti earthquake and the Tsunami of 2004 were incredible tragedies that have no precedence for over 200 years since the Krakotoa Eruption and earthquake and the Great Lisbon earthquake.

In 1997 there were only 3 notable quakes. neic.usgs.gov...

1998 saw 10 notable quakes. neic.usgs.gov...

In 1999 there were 13 notable quakes: neic.usgs.gov...

In 2000 there were 6 notable earthquakes. neic.usgs.gov...

In 2001 the number increased to 7. neic.usgs.gov...

By 2002 we jumped to 12 notable quakes. neic.usgs.gov...

Hold on, because in 2003 it was 39 notable quakes. neic.usgs.gov...

2004 calmed to just 39! neic.usgs.gov...


The intensity of the earthquakes as well as the frequency has increased . This year alone we had over 4 major earthquakes with significant loss of life . The Haiti earthquake and the Tsunami of 2004 were incredible tragedies that have no precedence for over 200 years since the Krakotoa earthquake and the Lisbon earthquake.

In 1997 there were only 3 notable quakes. neic.usgs.gov...

1998 saw 10 notable quakes. neic.usgs.gov...

In 1999 there were 13 notable quakes: neic.usgs.gov...

In 2000 there were 6 notable earthquakes. neic.usgs.gov...

In 2001 the number increased to 7. neic.usgs.gov...

By 2002 we jumped to 12 notable quakes. neic.usgs.gov...

Hold on, because in 2003 it was 39 notable quakes. neic.usgs.gov...

2004 calmed to just 39! neic.usgs.gov...

Since 2004 there have been an incredible increase . . Ones that come to mind are the Pakistan earthquake. Sichuan China, Italy, Afghanistan , Iran, Tsunami Aceh and many many others.

Please click on graph below to see this from the Us government showing the proof . Tom Aliki I suggest you show the contrary.

earthquakes%20usgs%20graph08.jpg


http://www.scientificblogging.com/florilegium/blog/why_so_many_earthquakes_decade

While Haiti is still sorting out the chaos from its January earthquake, the Earth suffers another massive quake in Chile. At a magnitude of 8.8 on the Richter scale this is one of the most powerful earthquakes ever recorded. Concerns about a tsunami spreading across the Pacific have abated and the Chilean authorities claim they have the resources to handle the catastrophe.

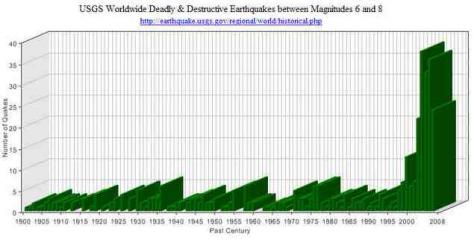
Why are we having so many earthquakes recently? Is it just that the media likes to report dramatic and tragic events, or has there been a quantitative increase? The graph below tells a worrying story.

The graph is compiled from data from the US Geological Survey (USGS), which monitors earthquakes throughout the globe. The data goes back over 100 years and looks as if this was compiled in 2007 or 2008. The URL which it points to has worldwide data on earthquakes but no longer has a graphical representation. Perhaps the graph is so alarming the USGS decided not to show data in this way. Just to fill in the recent data: 2008 saw 35 earthquakes of magnitude 6 and over; and 2009 saw a record-breaking 52, taking it way off the above scale - you can go count them yourself!


This alarming increase seems to have started in 1999. The conspiracy theorists have been all over this like a rash and numerous fingers are pointing to HAARP technology. There is increasing evidence that HAARP technology can alter the weather, but can it cause earthquakes? Even the official literature states that starting in 1996 HAARP tested its capabilities for geological mapping using ELF waves by modulating the ambient current in the ionosphere using HF radio waves. The official HAARP website has some interesting simulations of the fields created in the Earth's ionosphere-magnetosphere. Weather modification is another hornet's nest so I'd like to keep this to earthquakes.

However, this isn't a conspiracy website, so are there any scientists in this field who can explain this huge spike in earthquakes? An artefact of more measuring stations, surely not?


We are four months into 2010 and the earthquake season will become very worse if you judge the amount of volcanoes coming to life from Iceland, Japan, Chile, Italy and others. These volcanoes have been dormant for centuries and now they are reawakening.

The number of casualties pertain to a different debate i.m.o. (we had over 4 major earthquakes with significant loss of life . The Haiti earthquake and the Tsunami of 2004 were incredible tragedies that have no precedence for over 200 years since the Krakotoa Eruption and earthquake and the Great Lisbon earthquake).

Too, more and more stations are being installed throughout the world, which has brang a very different approach regarding eartquakes during the last century.

Let's not forget as well that the magnitude of the 1906 San Francisco eartquake is still debated nowadays (somewhere in-between 7.8 and 8.25).

Too, without even discussing the fact if there are more or less earthquakes, I think it could be hard to point out an evolution in one way or the other.
What do represent ten years, even one hundred or one thousand compared to the earth timeline. I mean that if the whole earth history from its beginning was represented as a pile of paper sheets of the size of the Eiffel tower, the Humanity history would represent the thickness of only two sheets.

There can be variations (Variance) but variance does not represent a trend.

On the scientificblogging website you refer to, reading "Perhaps the graph is so alarming the USGS decided not to show data in this way" sounds a bit like conspirationnist stuff.

Last, even if there was a trend with more major earthquakes, there would be -globally- reasons not to get that worried since at the same times architectural norms (except in 4th world countries I agree -let's hope Haiti will be rebuilt correctly) tend to be better every year in every country.

You, I, all of us have more chances dying from a stupid accident (slipping in the stairs) than dying from an earthquake, and that's much more frightening.
Nevertheless, I'll spill the blood of one or two chickens in my house just to make sure :p
 
This is from another page on the USGS site.


2000_both.gif


1990_both.gif


1980_both.gif
 
jp said:
pericles, did you read french jurists link?
http://earthquake.usgs.gov/earthquakes/eqarchives/year/eqstats.php

Its the actual data from USGS, from their own website

It tells a distinctly different story to the article you've posted.

If you look at the graph that you posted clearly you can see anomalies 2001 to 2010 below between 4 and 5 on richter scale.
8008,7991,8541,8462,10888, 13917, 12838, 12078 ,12291 ,6956, 2057
From 1991 to 1999 Below .
4437,4335,5128,4999,4518,8003,8756,7903,7303,6972

Major earthquakes above 7 very rarely hit populated areas but in the last 10 years there has been an incredible increase. I do not remember many earthquakes from 1980 to 2000 that devasted cities and communities like now

Deaths by earthquakes have dramatically increased as shown by the graph posted by JP.
If you just look at the periods between 1980 to 1990 59000 people died by earthquakes approximately and in the 2000 to 2010 period there were over 450, 000 deaths approximately. This is a 8 fold increase.

Many people have noticed of late very strange weather patterns and they are increasing in scope and in tragedy .
 
pericles said:
Major earthquakes above 7 very rarely hit populated areas but in the last 10 years there has been an incredible increase. I do not remember many earthquakes from 1990 to 2000 that devasted cities and communities like now . Deaths by earthquakes have dramatically increased as shown by the graph posted by JP.

That in itself is a question that I like answered.

It's just a question of mathematics. If true, you could even reverse the question : why during 1990-2000 so few earthquakes affected populated areas ? Variance it not equal to zero regarding earthquakes.
 
From USGS:
Are Earthquakes Really on the Increase?


We continue to be asked by many people throughout the world if earthquakes are on the increase. Although it may seem that we are having more earthquakes, earthquakes of magnitude 7.0 or greater have remained fairly constant.
A partial explanation may lie in the fact that in the last twenty years, we have definitely had an increase in the number of earthquakes we have been able to locate each year. This is because of the tremendous increase in the number of seismograph stations in the world and the many improvements in global communications. In 1931, there were about 350 stations operating in the world; today, there are more than 8,000 stations and the data now comes in rapidly from these stations by electronic mail, internet and satellite. This increase in the number of stations and the more timely receipt of data has allowed us and other seismological centers to locate earthquakes more rapidly and to locate many small earthquakes which were undetected in earlier years. The NEIC now locates about 20,000 earthquakes each year or approximately 50 per day. Also, because of the improvements in communications and the increased interest in the environment and natural disasters, the public now learns about more earthquakes.
According to long-term records (since about 1900), we expect about 17 major earthquakes (7.0 - 7.9) and one great earthquake (8.0 or above) in any given year
 
Population has increased dramatically as well. Seems the world population in the late 70s/early 80s (when I went to high school) was around 4.5 billion. Last I heard seems like we were over 6 billion?

Here's a population growth graphic for the last 2000 years:

http://desip.igc.org/populationmaps.html

Seems to me that the more dense population becomes, the bigger the buildings, and particularly in poorer areas of the world, we will see more and more deaths because 1) there are more people concentrated and 2) bigger buildings (maybe) with not so good construction to withstand big earthquakes in poorer parts of the world (where a lot of the population growth is occurring). And 3) statistics work (as someone mentioned previously) over long periods of time, but big movements of tectonic plates will happen at specific times that will cause more mayhem in small times over the "flattened curve" of statistics extended over a great length of time.

This is actually the same sort of thing that people who think humans have caused global warming fail to see (the data over longer periods of time than the IPCC uses actually shows we may be entering a small ice age...) - and we actually know quite a bit more about that data over a LOT LONGER time than we do earthquakes.

And as far as modern-day catastrophic earthquakes - San Francisco 1989 was a huge one as well, but not as many people died because the building codes related to earthquakes were a lot better in San Francisco than Haiti (as an example). And it wasn't covered by a tsunami like the one in Indonesia et al.

Haiti 2010 = 7.0 (220,000+ deaths)
Chile 2010 = 8.8 (700+ deaths)
SF 1989 = 7.1 (57 deaths)

That tells quite a bit, really, about deaths and buildings codes, I think. Chile would maybe have been much more like SF's, but 1.7 points on the scale is a HUGE difference - the quake in Chile was much stronger than either SF or Haiti, one of the strongest ever recorded.
 
The only reason the earthquake in Haiti is notable is due faulty construction. If those buildings were reinforced with re-bar (not just blocks stacked up on each other) there would of been a lot less damage/death.
 
French jurist said:
According to http://earthquake.usgs.gov/earthquakes/eqarchives/year/eqstats.php
there doesn't seem to be a dramatic increase in seismic activity.
In fact, until 2006, seismisc activity was rather calm.

Well over 8.0 from 1990 - 1999: 6
And 2000-2010: 14

http://earthquake.usgs.gov/earthquakes/eqarchives/year/info_1990s.php
http://earthquake.usgs.gov/earthquakes/eqarchives/year/eqstats.php

That's more than the double with 4 of them in 2007 alone. Quite unprecedented that I know. Although I can't seem to find similar statistics starting from last century.
 
Status
Not open for further replies.
Back
Top