Margaret Thatcher Is Dead ...

Thatcher was one of the most divisive people in British politics. I for one, am not a fan.

Her policies decimated whole communities, I can never forgive that! In the area I lived in, the Rhondda Valley in South Wales, her policies were like a tsunami coming through, leaving scant little in its path. I remember the optimism on her election in 79, especially amongst working class council home people, with the notion that they would be able to buy their homes. Some did! Them I remember the same people a few years later desperate as unemployment reached an all time high, they lost their jobs, their families, their homes and in some sad cases committed suicide as they had lost all hope.

I'll be sure to watch the funeral, to make sure they really put her away!
 
People who were on the dole, who currently are on the dole or have aspirations to be on the dole in the future will hate Ms. Thatcher for all times.
 
I like (not) the way the BBC is foaming at the mouth and trying so hard to (not) show both sides of the story.
There are going to be some very uncomfortable and shifty people at the funeral next Wednesday who'd rather be somewhere else, methinks.
 
Evolution of inequality in the UK

901776_10200352275802414_509000237_o.jpg
 
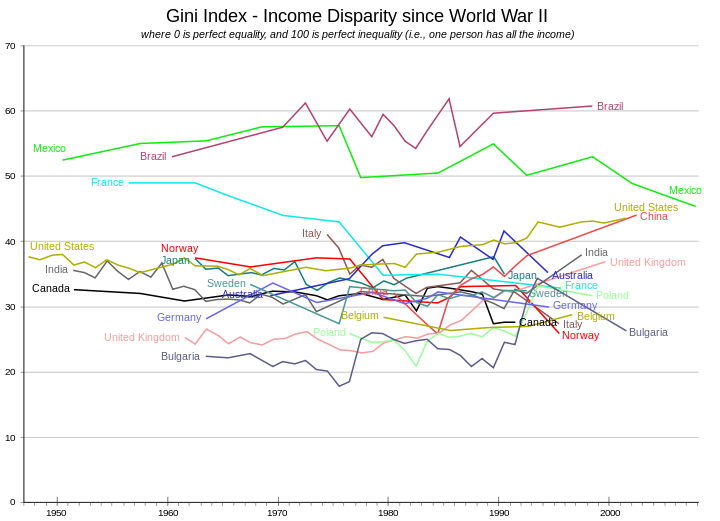
Some may claim the Gini Index was manipulated ...?? The lower the INDEX the better distribution of wealth?

The lower the number, the better is the income distribution (note it is income, not wealth)
The index per se cannot be manipulated as it is a simple, well know formula. Of course, if the income data is wrong, the index would be wrong as well.
I do not think the data/index is wrong for the UK... it reflects quite well the dynamics of inequality in the country in the last 50 or so years.
 
Evolution of inequality in the UK

901776_10200352275802414_509000237_o.jpg

Well, done. A pinprick, snapshot of data that effectually exaggerates a point you may had wished to show.

Unfortunately, if you check the many other Gini index charts you could have picked from Google images, they wouldn't have any where nearly as effectually demonstrated this huge spike of inequality in the Margareth (sic) Thatcher years.
Other charts show the full scale of inequality over a longer period and in comparison to other countries, and with tax comparisons, effectively reducing whatever reason there was to ever post this chart in the first place.

NB. I am apathetic as to whether the chart is wrong or right, or whether there was a rise in the inequality index. What pisses me off is the abuse and misuse of data.

I am trying to understand your argument if you have any. I only posted a chart using data from the IFS, the most reputable authority on Fiscal Issues in the UK. I did not do any claim nor I tried to convince you of anything. Since you seem to be an expert on data, bring yours and we can discuss it. Most Gini calculation using before or after tax income for the UK show an increase in inequality during the 1980s. We can then discuss if this is part of a global phenomenon or attributed to Maggie's policies. And if attributed to Maggie's policies we can discuss on the long term effects (temporary or permanent? more efficient economy?).

As I said, I am happy to debate, but bring something we can debate about.
 
If you bury the UK data in a larger data set, and use a larger scale you can mask the spike in inequality that began during Thatcher's time in office. But that would constitute abuse of data, so we wouldn't want to do that...
 
Back
Top